Tiedosto:Befolkningsutvikling kommune 0101.svg

Tämän PNG-esikatselun koko koskien SVG-tiedostoa: 300 × 130 kuvapistettä. Muut resoluutiot: 320 × 139 kuvapistettä | 640 × 277 kuvapistettä | 1 024 × 444 kuvapistettä | 1 280 × 555 kuvapistettä | 2 560 × 1 109 kuvapistettä.
Alkuperäinen tiedosto (SVG-tiedosto; oletustarkkuus 300 × 130 kuvapistettä; tiedostokoko 3 KiB)
| Tämä tiedosto on tiedostotietokanta Wikimedia Commonsista. Tiedot kuvaussivulta näkyvät alla. |  |
Tiedoston kuvaussivu Commonsissa |
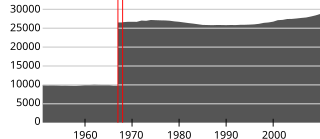
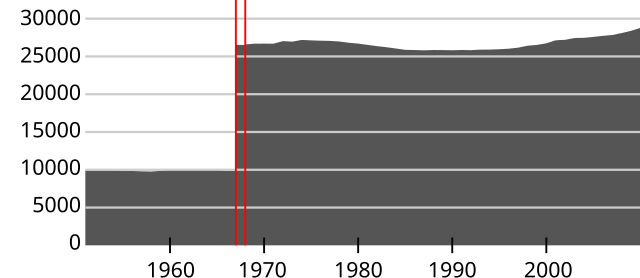
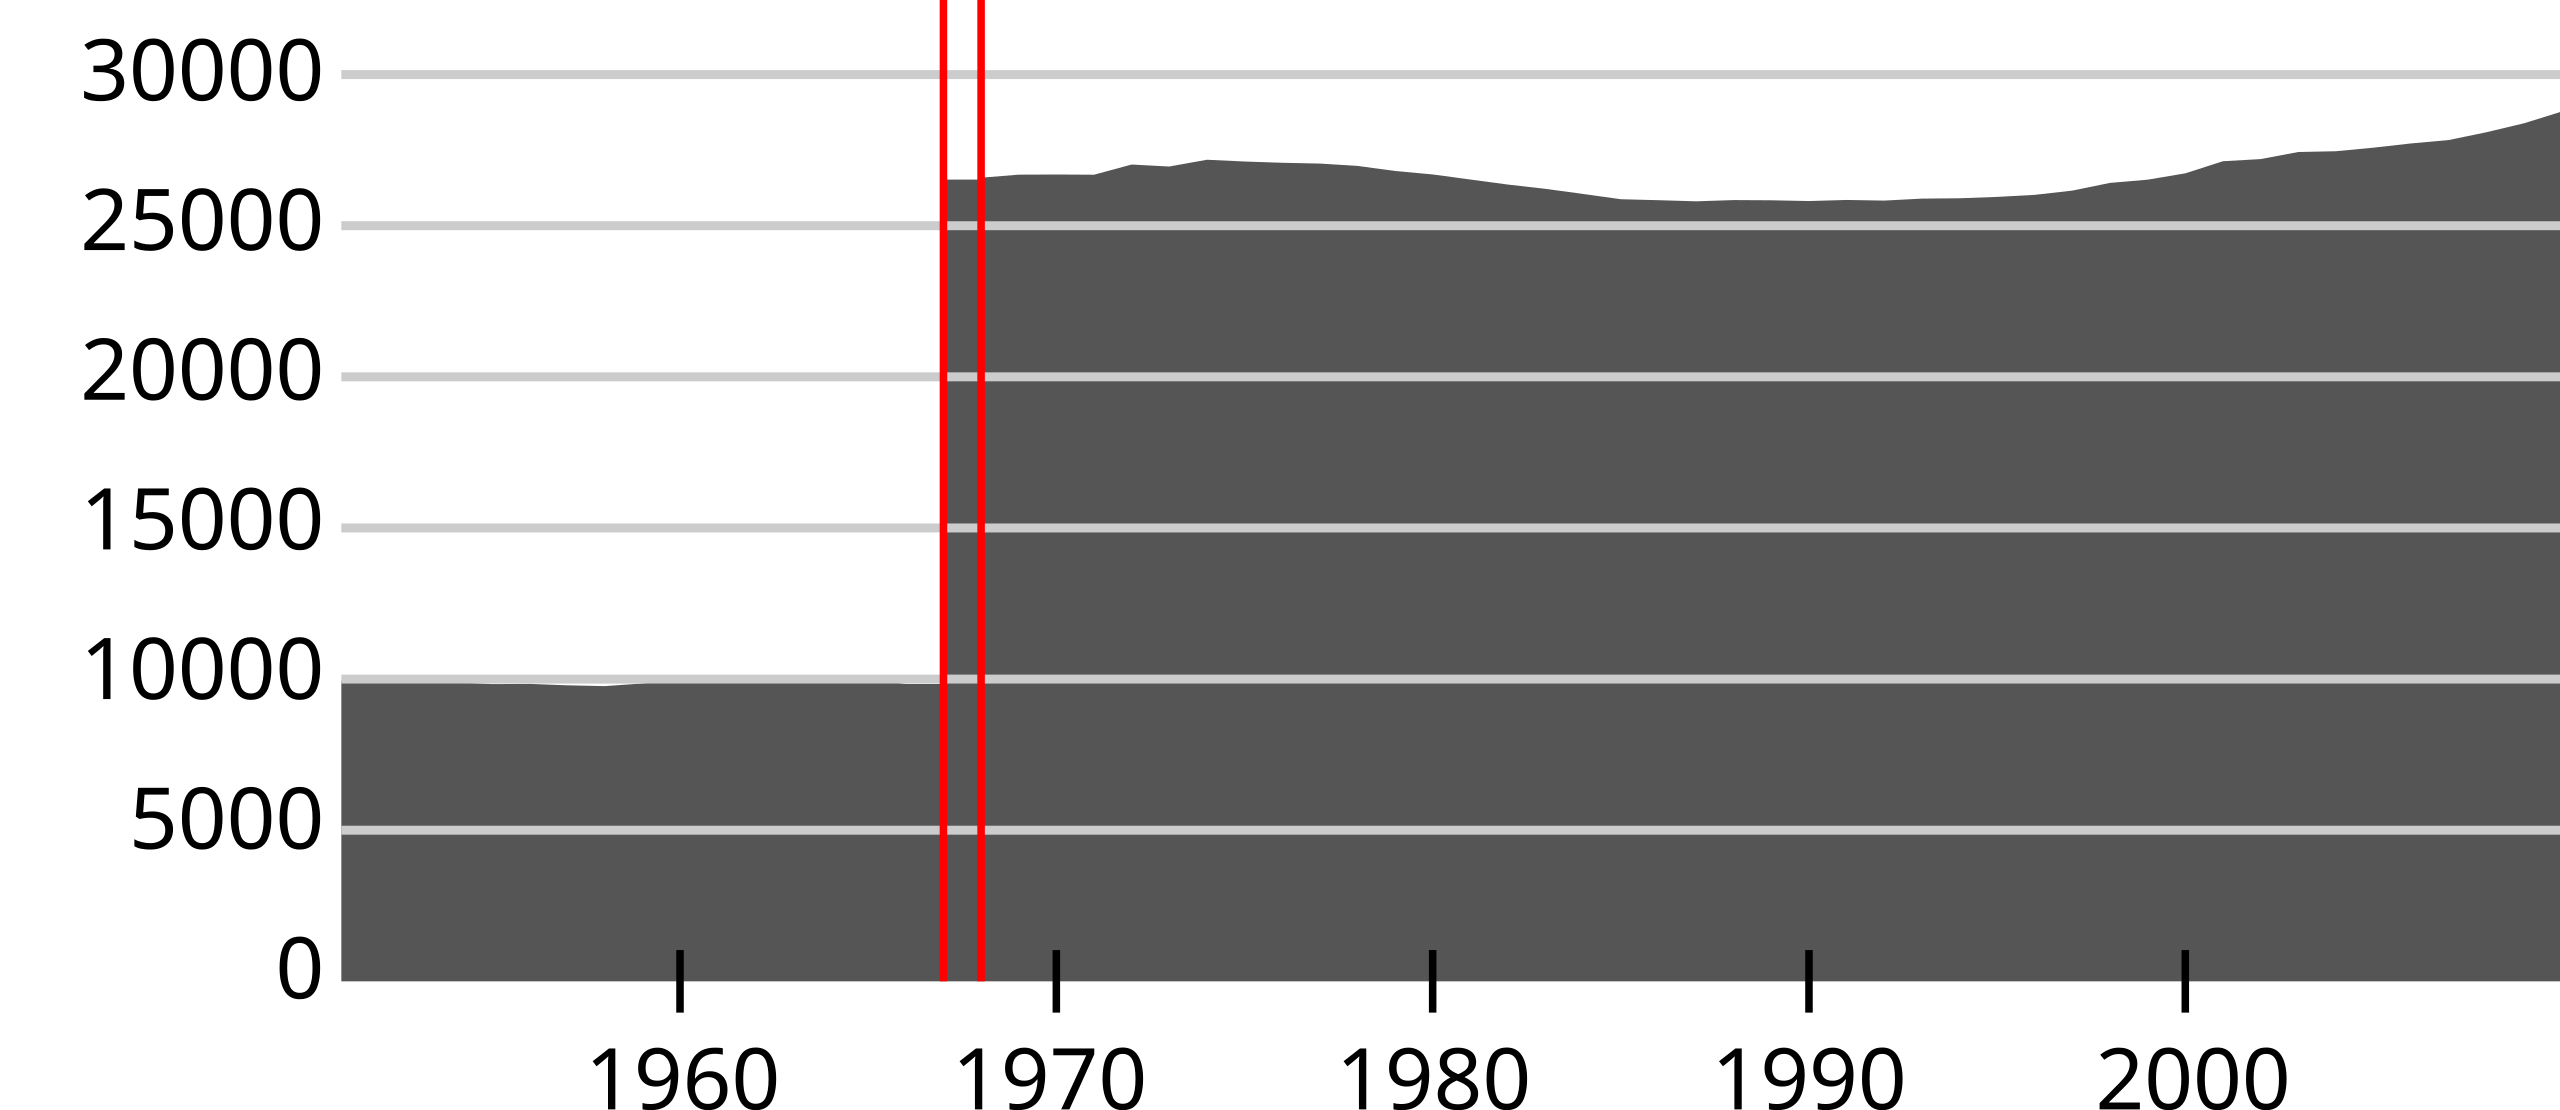
| Kuvaus | Population development graph for Norwegian municipalities 1951-current year (file will be updated annually). Vertical red bars indicate changed municipal borders, mergers, etc. (specified in source). |
| Päiväys | |
| Lähde | Own work, data source is Statistics Norway's website |
| Tekijä | Btd |
| Käyttöoikeus (Tämän tiedoston uudelleenkäyttö) |
The material on [ssb.no] (text, statistical tables and diagrams) may be stored electronically, printed, copied and forwarded to other parties. The permission is given on the provision that reference is made to the source from which the material is obtained (Source: Statistics Norway). The source shall be quoted in direct connection with each table and diagram that is used.[1] |

|
Tämän teoksen tekijänoikeuksien haltija, Statistics Norway, sallii kenen tahansa käyttää sitä mihin tahansa tarkoitukseen, edellyttäen että tekijänoikeuksien haltija on asianmukaisesti mainittu. Teoksen uudelleen käyttö, muokkaaminen, kaupallinen käyttö ja muu käyttö on sallittu. |
Nimeä:
Statistics Norway
|
Tiedoston historia
Päiväystä napsauttamalla näet, millainen tiedosto oli kyseisellä hetkellä.
| Päiväys | Pienoiskuva | Koko | Käyttäjä | Kommentti | |
|---|---|---|---|---|---|
| nykyinen | 31. maaliskuuta 2010 kello 14.53 | | 300 × 130 (3 KiB) | Btdbot | adding 2010 data |
| 27. heinäkuuta 2009 kello 18.02 |  | 300 × 130 (3 KiB) | Btd | {{Information |Description=Population development graph for Norwegian municipalities 1951-current year ('''file will be updated annually'''). Vertical red bars indicate changed municipal borders, mergers, etc. (specified in source). |Source=Own work, da | |
| 22. syyskuuta 2008 kello 15.46 |  | 300 × 130 (3 KiB) | Btd | {{Information |Description=Population development graph for Norwegian municipalities. Vertical red lines indicate municipal limits changes, mergers and splits. |Source=Own work, data source is Statistics Norway |Date=2008-09-20 |Author=Btd |Permission=GNU | |
| 22. syyskuuta 2008 kello 15.45 |  | 300 × 130 (3 KiB) | Btd | {{Information |Description=Population development graph for Norwegian municipalities. Vertical red lines indicate municipal limits changes, mergers and splits. |Source=Own work, data source is Statistics Norway |Date=2008-09-20 |Author=Btd |Permission=GNU | |
| 22. syyskuuta 2008 kello 15.32 |  | 300 × 130 (3 KiB) | Btd | {{Information |Description=Population development graph for Norwegian municipalities. Vertical red lines indicate municipal limits changes, mergers and splits. |Source=Own work, data source is Statistics Norway |Date=2008-09-20 |Author=Btd |Permission=GNU | |
| 22. syyskuuta 2008 kello 15.25 |  | 300 × 130 (3 KiB) | Btd | {{Information |Description=Population development graph for Norwegian municipalities. Vertical red lines indicate municipal limits changes, mergers and splits. |Source=Own work, data source is Statistics Norway |Date=2008-09-20 |Author=Btd |Permission=GNU | |
| 22. syyskuuta 2008 kello 15.24 |  | 300 × 130 (3 KiB) | Btd | {{Information |Description=Population development graph for Norwegian municipalities. Vertical red lines indicate municipal limits changes, mergers and splits. |Source=Own work, data source is Statistics Norway |Date=2008-09-20 |Author=Btd |Permission=GNU | |
| 22. syyskuuta 2008 kello 15.14 |  | 300 × 130 (3 KiB) | Btd | {{Information |Description=Population development graph for Norwegian municipalities. Vertical red lines indicate municipal limits changes, mergers and splits. |Source=Own work, data source is Statistics Norway |Date=2008-09-20 |Author=Btd |Permission=GNU | |
| 20. syyskuuta 2008 kello 00.55 | 300 × 110 (1 KiB) | Btd | {{Information |Description=Population development graph for Norwegian municipalities. |Source=Own work, data source is Statistics Norway |Date=2008-09-20 |Author=Btd |Permission=Own work, attribution required (Multi-license with GFDL and Creative Commons | ||
| 20. syyskuuta 2008 kello 00.51 | 300 × 110 (1 KiB) | Btd | {{Information |Description=Population development graph for Norwegian municipalities. |Source=Own work, data source is Statistics Norway |Date=2008-09-20 |Author=Btd |Permission=Own work, attribution required (Multi-license with GFDL and Creative Commons |
Tiedoston käyttö
Seuraava sivu käyttää tätä tiedostoa:
Tiedoston järjestelmänlaajuinen käyttö
Seuraavat muut wikit käyttävät tätä tiedostoa:
- Käyttö sivustolla no.wiki.x.io
- Käyttö sivustolla sq.wiki.x.io