Tiedosto:Larsen B Collapse Size Comparison.png
Larsen_B_Collapse_Size_Comparison.png (540 × 498 kuvapistettä, 520 KiB, MIME-tyyppi: image/png)
| Tämä tiedosto on tiedostotietokanta Wikimedia Commonsista. Tiedot kuvaussivulta näkyvät alla. |  |
Tiedoston kuvaussivu Commonsissa |
Yhteenveto
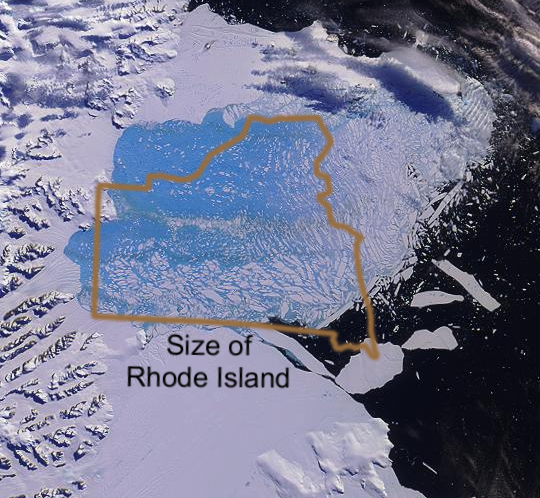
This satellite image shows the 2002 breakup of the Larsen B Ice Shelf in comparison of the US state of Rhode Island. This region, covering approximately 3250 km2 with 200 meter thick ice, had been continuously glaciated since before the end of the last glacial period.
The light blue color is a false color enhancement showing the region of breakup based on apparent temperature differences (measured in infrared wavelengths) of ocean water versus water previously under the ice shelf.
Though it is believed that the Larsen B Ice Shelf had been thinning for thousands of years[1], the recent changes associated with global warming and an exceptionally warm summer in 2002 are considered the immediate causes of the collapse. The leading theory for explaining abrupt ice sheet collapse is that melt water forming on the surface of the ice sheet works its way into crevasses, where it would subsequently refreeze and expand, thus exerting pressure on the ice and causing the crevasses to grow and propagate. This hypothesis suggests that such crevasses became so widespread that the normal amounts of stress associated with ice sheet flow and the calving of icebergs started a chain reaction that caused the ice sheet to disintegrate.
Source: http://www.globalwarmingart.com/wiki/Image:Larsen_B_Collapse_Size_Comparison_png
Lisenssi
The original version of this figure was prepared by Robert A. Rohde from publicly available data and is incorporated into the Global Warming Art project.

|
Voit kopioida, levittää ja/tai muuttaa tätä asiakirjaa GNU Free Documentation License -lisenssin version 1.2 tai minkä tahansa Free Software Foundationin julkaiseman myöhemmän version ehtojen alaisena; ei koske muuttumattomia kohtia, etukannen tekstejä eikä takakannen tekstejä. Kopio tästä lisenssistä on saatavilla osiossa GNU Free Documentation License. |
| Tämä tiedosto on lisensoitu Creative Commons Nimeä-JaaSamoin 3.0 Ei sovitettu -lisenssillä. | ||
| ||
| Lisensointimerkintä lisätiin tähän tiedostoon osana GFDL-lisensointipäivitystä. |
Tiedoston historia
Päiväystä napsauttamalla näet, millainen tiedosto oli kyseisellä hetkellä.
| Päiväys | Pienoiskuva | Koko | Käyttäjä | Kommentti | |
|---|---|---|---|---|---|
| nykyinen | 26. marraskuuta 2006 kello 00.03 | | 540 × 498 (520 KiB) | IqRS~commonswiki | This satellite image shows the 2002 breakup of the Larsen B Ice Shelf in comparison of the US state of Rhode Island. This region, covering approximately 3250 km2 with 200 meter thick ice, had been continuously glaciated since before the end of the last gl |
Tiedoston käyttö
Seuraava sivu käyttää tätä tiedostoa:
Tiedoston järjestelmänlaajuinen käyttö
Seuraavat muut wikit käyttävät tätä tiedostoa:
- Käyttö sivustolla ca.wiki.x.io
- Käyttö sivustolla de.wiki.x.io
- Käyttö sivustolla es.wiki.x.io
- Käyttö sivustolla hu.wiki.x.io
- Käyttö sivustolla ja.wiki.x.io
- Käyttö sivustolla pt.wiki.x.io